

How To Create Hierarchy Tree In Excel: Hi everyone! If you’re here, it means you want to learn how to make a hierarchy tree in Excel. In Excel, “hierarchy” can refer to two things. First, it can be a chart that shows a structure, like an organization chart. Second, it can be a SmartArt hierarchy.
This guide will teach you two methods to create hierarchies in Excel: using SmartArt to make a hierarchy chart and creating a hierarchy chart directly. So without any delay, Let’s Start.
Method 1 – Using SmartArt Tool
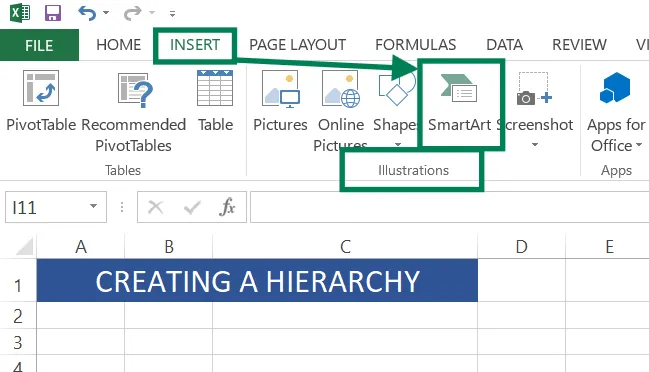
Step 1: Go to Insert > Illustrations > SmartArt.
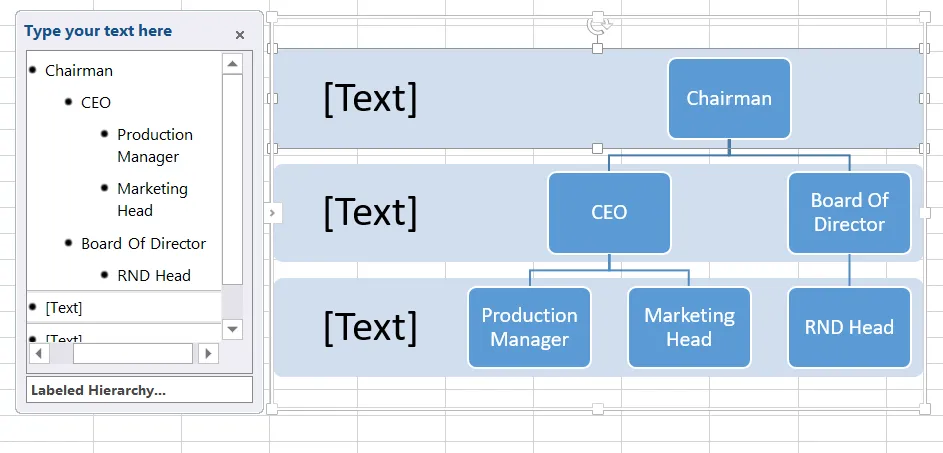
Step 2: A window will open. Choose Hierarchy and pick a template. We’ll use the Labeled Hierarchy option.

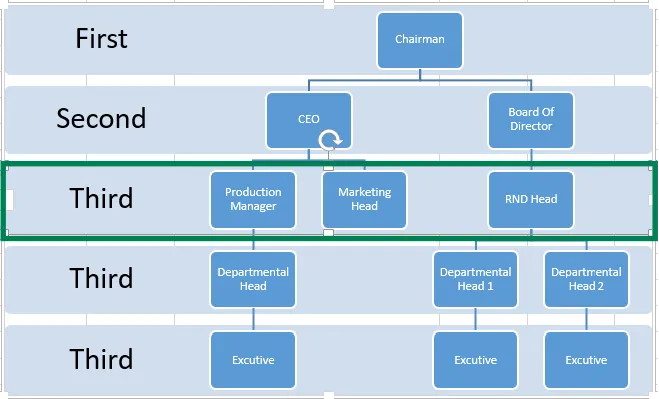
Step 3: The template will appear. Fill in the boxes with the job titles from your data, like First, Second, etc.
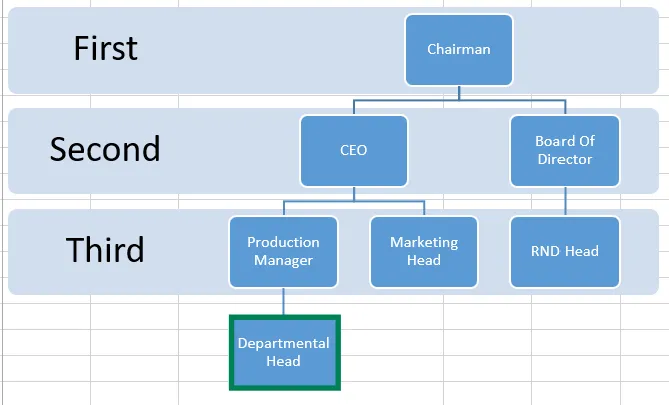
Step 4: If there aren’t enough boxes for all the job titles, you can add more. For example, to add a box for the Departmental Head under the Production Manager, select the Production Manager box, go to SmartArt Design > Add Shape > Add Shape Below.

Step 5: Fill the new box with the correct job title.
Step 6: Repeat this to add boxes for Departmental Head 1 and 2 under the RND Head.

Step 7: Add boxes for the Executives the same way.
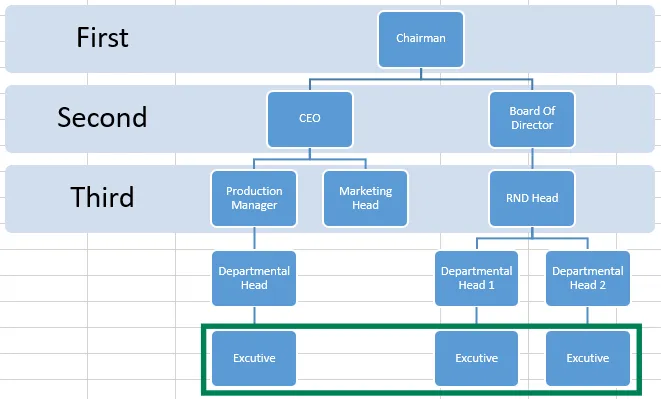
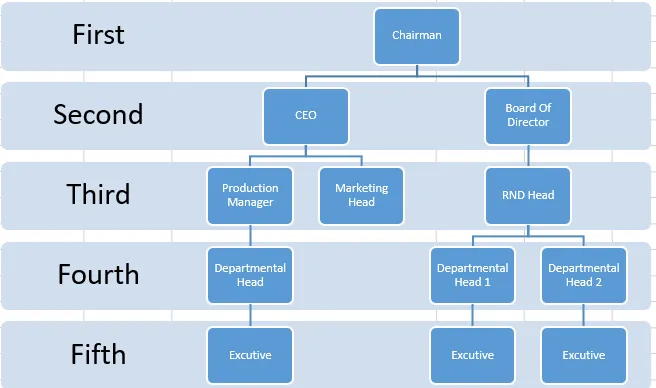
Step 8: To add labels for new levels, copy and paste them using CTRL+C and CTRL+V.
Step 9: Edit the labels to show the correct text.
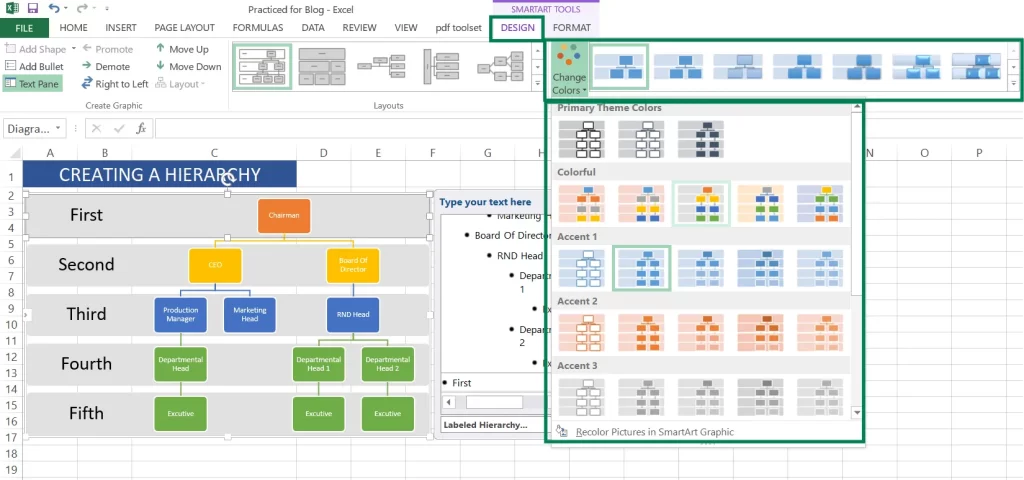
Step 10: You can change the design And Colour of your hierarchy tree by choosing a different style and colour from the SmartArt Design options.
Also Read: How To Create Barcode In Excel
Method 2 – Using Charts to Create a Hierarchy Treemap
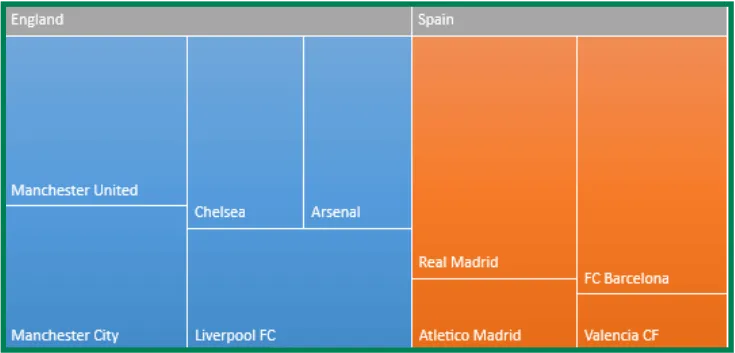
This method creates a treemap to show hierarchical data, like football clubs grouped by country and their net worth.
Step 1: Select your dataset (e.g., B4:E13). And Go to Insert > Chart > Treemap.
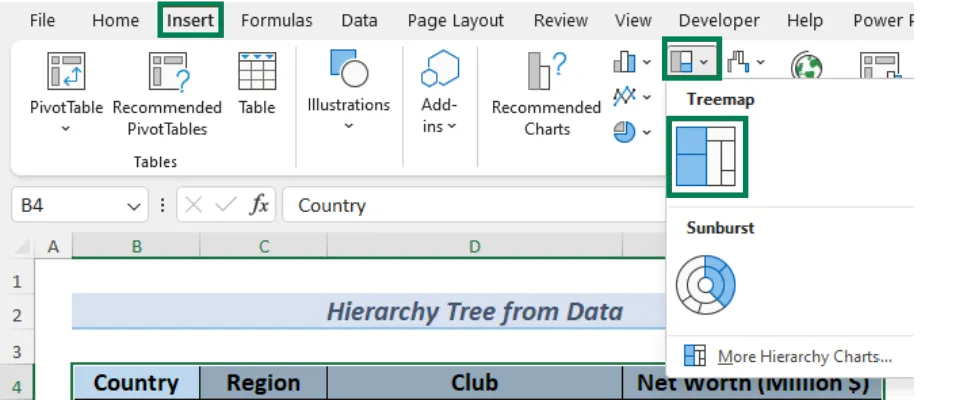
Step 2: A treemap will appear, grouping the clubs by country. The size of each club’s box shows its net worth.
Also Read: How To Create Chart In Excel From Table
Use Of Hierarchy In Excel
Hierarchy in Excel helps arrange data in a clear and organized way, making it simpler to understand and analyze. It is used in tools like PivotTables, charts, and grouped data. Excel lets users create relationships between main categories (parents) and subcategories (children), sort data, and use levels to make it easier to see patterns.
Functions like SUBTOTAL and GROUP help manage this structured data. Hierarchy makes reports and dashboards clearer and more effective. It is especially helpful in business analysis, project management, and organizing data for better decision-making.
Also Read: How To Create group To Collaps And Expand In Excel
Conclusion:
In Conclusion, making a hierarchy tree in Excel is easy and helps you see and organize your data better. You can use SmartArt, shapes, or formulas to arrange your data in a clear and simple way. Whether it’s for work, planning, or charts, Excel has tools to create a hierarchy tree that fits your needs.
Don’t forget to format it so it’s easy to read. By following these steps, you can make a hierarchy tree that shows complex information in a simple and attractive way. Try it today to make your work and data look better!
Thank You for reading till end!