
How To Create A Pivot Table In Excel Sheet : Hello Friends, I am here to solve your problem and in this guide i will tell you How To Create A Pivot Table In Excel Sheet and How To Use Pivet Table.
This guide will show you how to make a Pivot Table in Excel, step by step. You will learn how to add a Pivot Table, move data around, use filters, and change the table to fit your needs. This will help you turn complicated data into easy and useful information, making your work easier and faster.
What Is Pivot Table?
A pivot table is a way to organize and show your data in a simple chart. It helps you see patterns and compare numbers easily. This is useful when you have a lot of data in rows and columns and want to add up values and compare them quickly.
How To Create A Pivot Table In Excel Sheet
Simple Steps to Create a Pivot Table
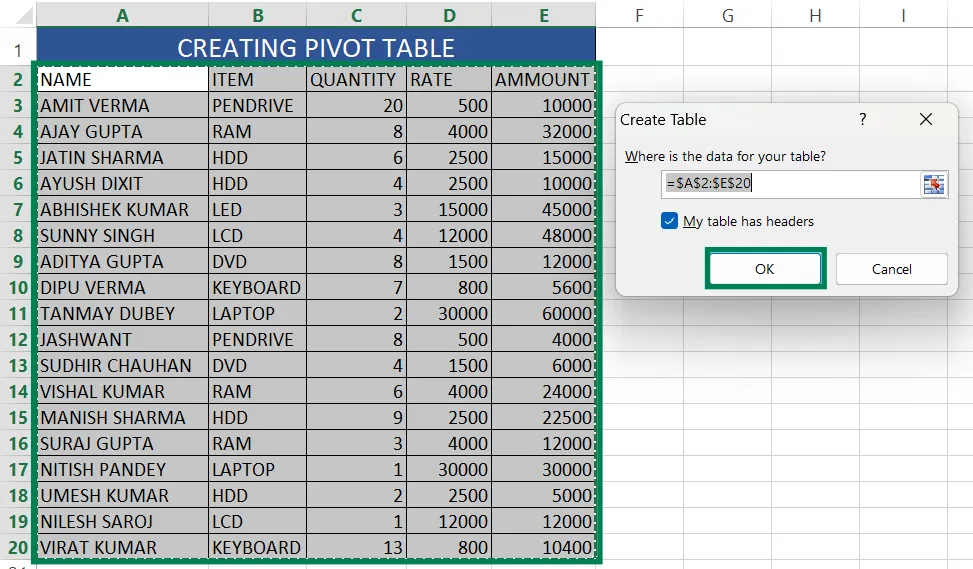
Step 1: Press CTRL + T to turn your data into a table and click OK.
Step 2: After making the table, you can choose a color for it.
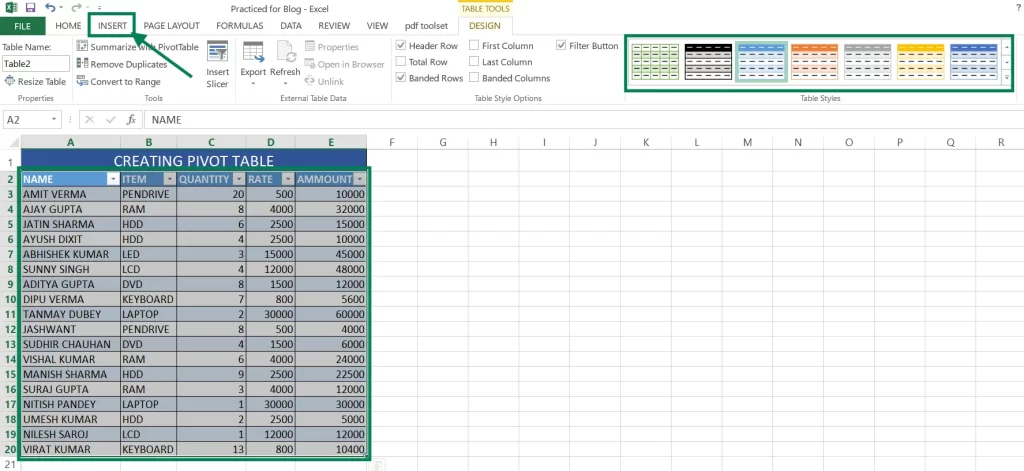
Step 3: Click on any cell in the table, then go to the Insert tab.
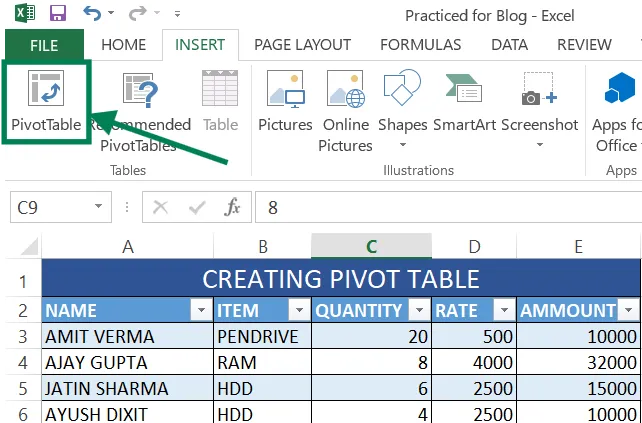
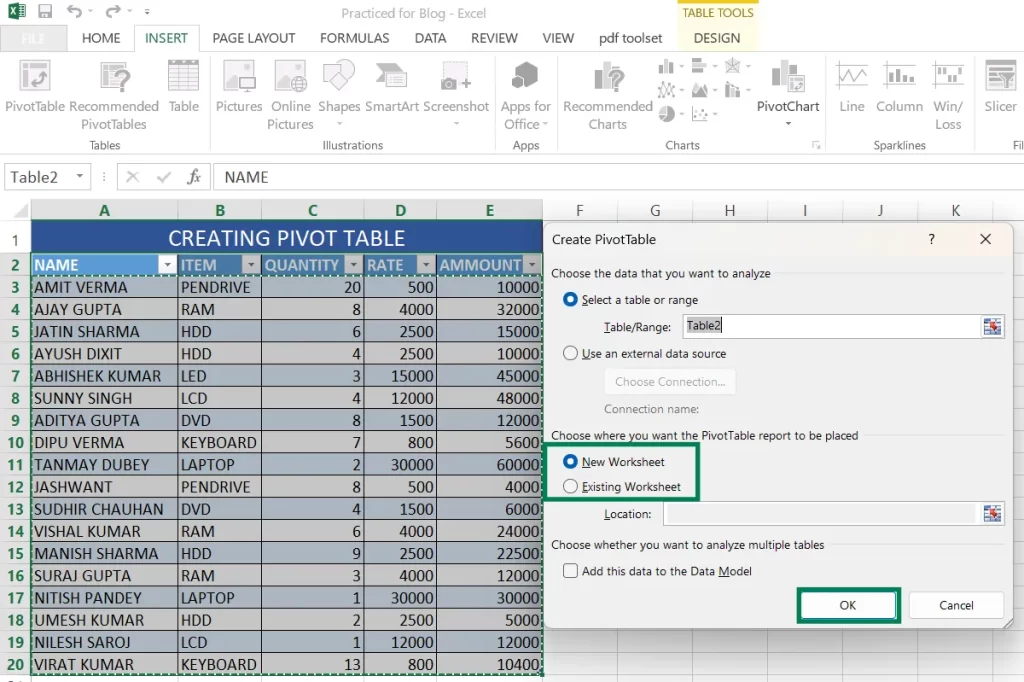
Step 4: In the Insert tab, find Pivot Table at the top and click on it.
Step 5: Choose where you want to place the Pivot Table – in the Same Worksheet or a New Worksheet – then click OK.
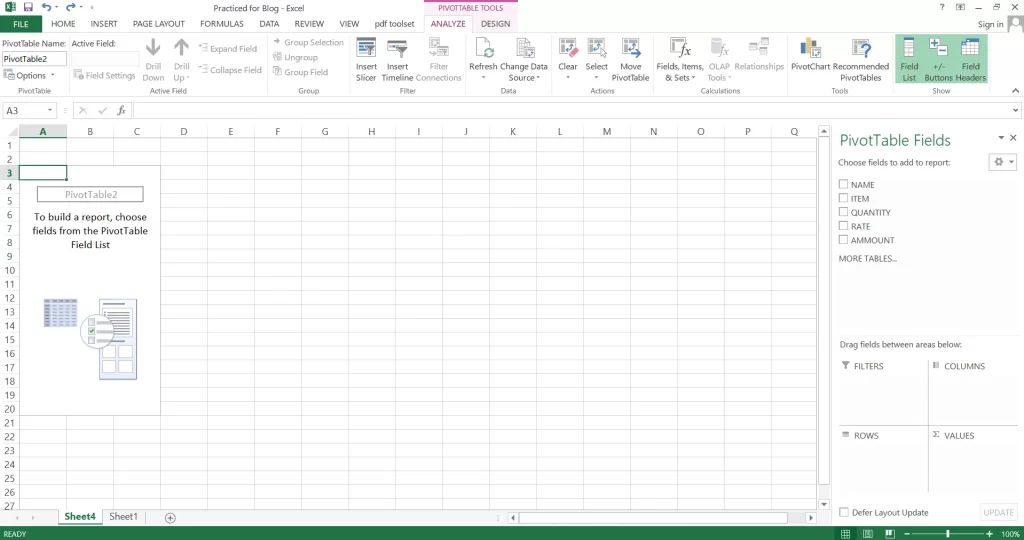
Now, look at the picture below. Your pivot table is ready.
Also Read: Create Drop Down List In Excel – In 6 Steps
How To Use Pivot Table In Excel Sheet
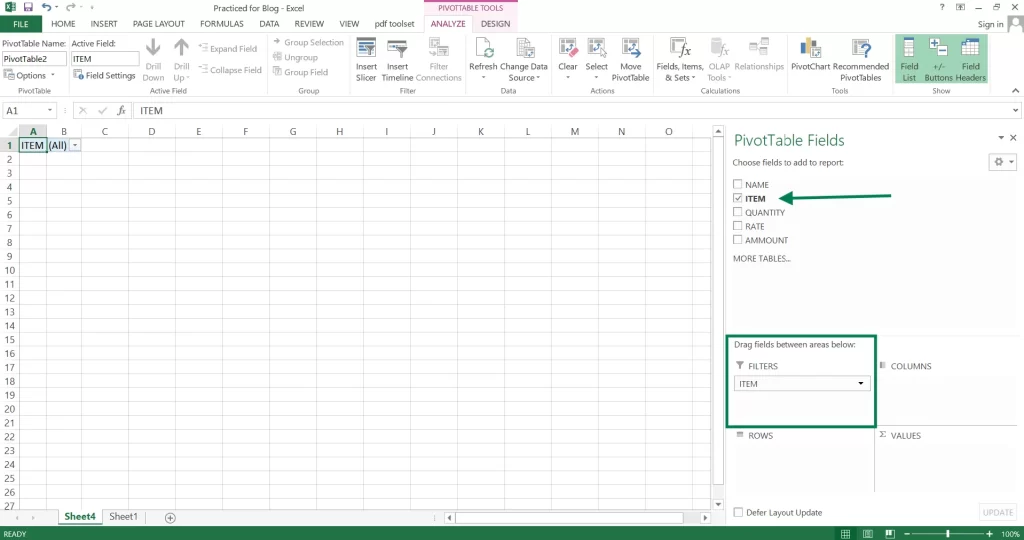
Step 1: First, make a Pivot Table. Then, drag one column name from your data into the filter section.
Step 2: Next, select all the other columns.
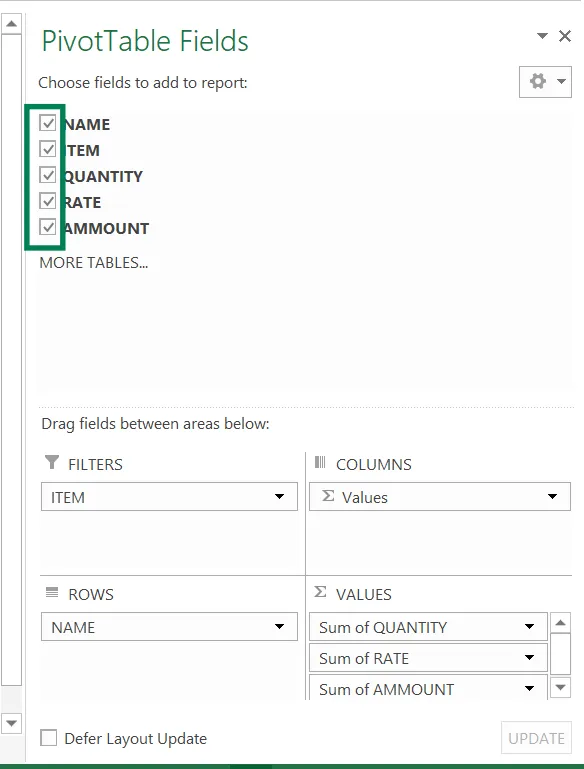
Step 3: Finally, use the dropdown to filter your data as needed.

Use Of Pivot Table In Excel Sheet
In MS Excel, a pivot table is a tool that helps organize and understand large amounts of data. It makes it easy to find patterns, see trends, and answer questions quickly.
Also Read: Create Drop Down List In Excel – In 6 Steps
Conclusion:
In Conclusion, making a Pivot Table in Excel helps you understand data easily. First, pick your data, then insert a Pivot Table, and change it as needed. It helps organize big data, making it simple to use. You can track sales, costs, or other numbers.
Learning this tool saves time and makes work easier. Try different layouts, filters, and options to see what works best. With practice, you can quickly create reports and make smart choices using data.